Investment Planning Model (IPM) Reports

This site and area-wide report service is used extensively to assess new build, franchise or contract options that require capital expenditure, and also to test the viability of changes to the facility offerings and analyse the current capacity at existing venues. Outputs underpin feasibility studies, business plans and infrastructure strategies across Australia and New Zealand, within the Leisure, Fitness, Recreation and Sport industries.
The accuracy of the predictive modelling and overall service is validated against actual outcomes from across the hundreds of venues integrated into ActiveXchange's Network.
Types of IPM Reports

Leisure & Aquatic IPM
Leisure & Aquatic IPM
Leisure & Aquatic IPM

Sport IPM
Leisure & Aquatic IPM
Leisure & Aquatic IPM
Report Inclusions

Venue Catchment Mapping
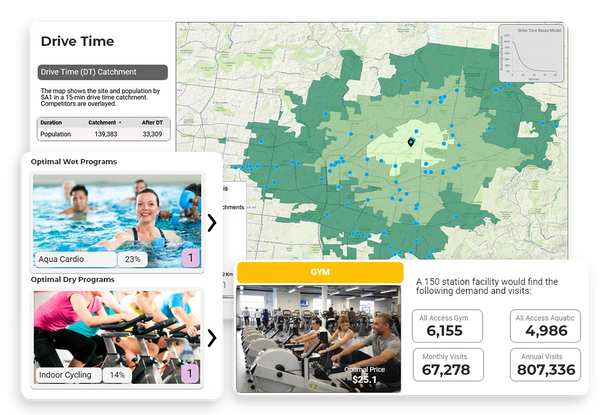
Mapping shows the site location/area and associated drive time catchment, overlaid with nearby competitors who offer similar, or like-for-like programs and services.

Drive Time (DT) Catchment
Mapping which visualises the site/area and predicted user catchments at a localised level (SA1), in specified drive time catchment bands, overlaid with nearby competitors who offer similar, or like-for-like programs and services.

Demand & Unmet Demand Projections
Map shows the site/area and associated demand for leisure, fitness, recreation and sport facilities by SA1, taking into account the drive-time decay.

Projected Users
Map shows the site/area and predicted users in the specified drive time catchment. This also factors in local competition and profile of the site/area.

Segmentation Profiling
Experian Mosaic segment profiles are detailed for your proposed site/area catchment to assist with targeted marketing and communications efforts.

Member & Visit Projections
Shows the projected number of members and associated visits across gym, swimming and group fitness for Aquatic and Recreation Operators, and projected "casual" and "formalised" participation for Sport. This includes modelling for the current year, as well as for 10 years into the future. Also captured as part of modelling is the optimal weekly price point for All Access and Aquatic only memberships.

Optimal Programming
View the optimal programs, according to local demand, across wet and dry-based classes from within the drive time catchment area, supported further through the ActiveXchange network insights.

Optimal Capacity
Understand the optimal capacity for a fitness based facility, which is determined by maximising the member per station ratio to achieve the greatest possible yield. Additionally, the Typical Visit Pattern outlays peak periods of demand and usage across your site/area to assist in planning operational resources.
What data question can we help you solve?
Copyright © 2024 ActiveXchange - All Rights Reserved.